As many members know, I live in Wanstead, the furthest west of any member in our region, I believe. I am not a Londoner by birth; I come from Bedford and my family background is actually the Cardiff and Newport area of South Wales, by coincidence a few miles from Llangibby. I moved to Wanstead some 25 years ago to avoid having to spend four hours a day on the train commuting back and fore to work.
Shortly after moving, I remember seeing an episode of Top Gear in which Quentin Wilson was talking about the best and worst places for learners to take their driving test. A small town in the highlands of Scotland had the best pass rate, probably because there were so few cars there that learners hardly ever came across another car. However, the place with the lowest pass rate was – you guessed it – Wanstead, mainly because of the Redbridge and Green Man roundabouts, dense traffic and nasty junctions everywhere.
That was about 25 years ago but, much more recently, I read a small newspaper article on the same topic and the results were unchanged with Wanstead still at the bottom. This got me thinking about the history of the driving test and the Highway Code, and how roads and traffic were very different when I learned to drive or when many of our cars were first designed. I started doing some research with the intention of writing a short article about this for our newsletter.
And so I shall next month, but this is not that article.
As I was researching, I found that the DVLA publishes a wealth of statistical information about cars as well, and this distracted me; it’s fascinating.
 For example, we often think there are more cars on the road now than there used to be, and it’s definitely true. There are more than 12 times the number there were in 1950. By September 2019 there were 38.9m licensed vehicles in Great Britain, of which 82.2% were cars, plus another 4.6m on SORN. In fact, the number has grown steadily by around 1% to 3% every year since World War 2, with just one exception in 1992, when the total fell by a tiny amount for some reason.
For all that, the roads are safer nowadays. In 1930, there were just 2.4m vehicles but 7,343 people were killed on the roads. That’s 1 death per 326 vehicles. But in 2008, there were just 2,538 deaths – almost 1/3 the number – despite there being 26.5m vehicles on the road. That’s 1 death per 10,440 vehicles.
The breakdown of vehicles is also interesting. The number of cars on SORN in September 2019, at 2.65m has more than doubled over the last ten years, up from 1.19m in September 2009, presumably as drivers have decided the tax savings are worthwhile. That’s even more true for motorcyclists, many of whom are ‘fair weather’ bikers and clearly lay up their machines for the winter; while motorcycles account for 3.5% of all licensed vehicles, they represent 22.3% of all vehicles on SORN.
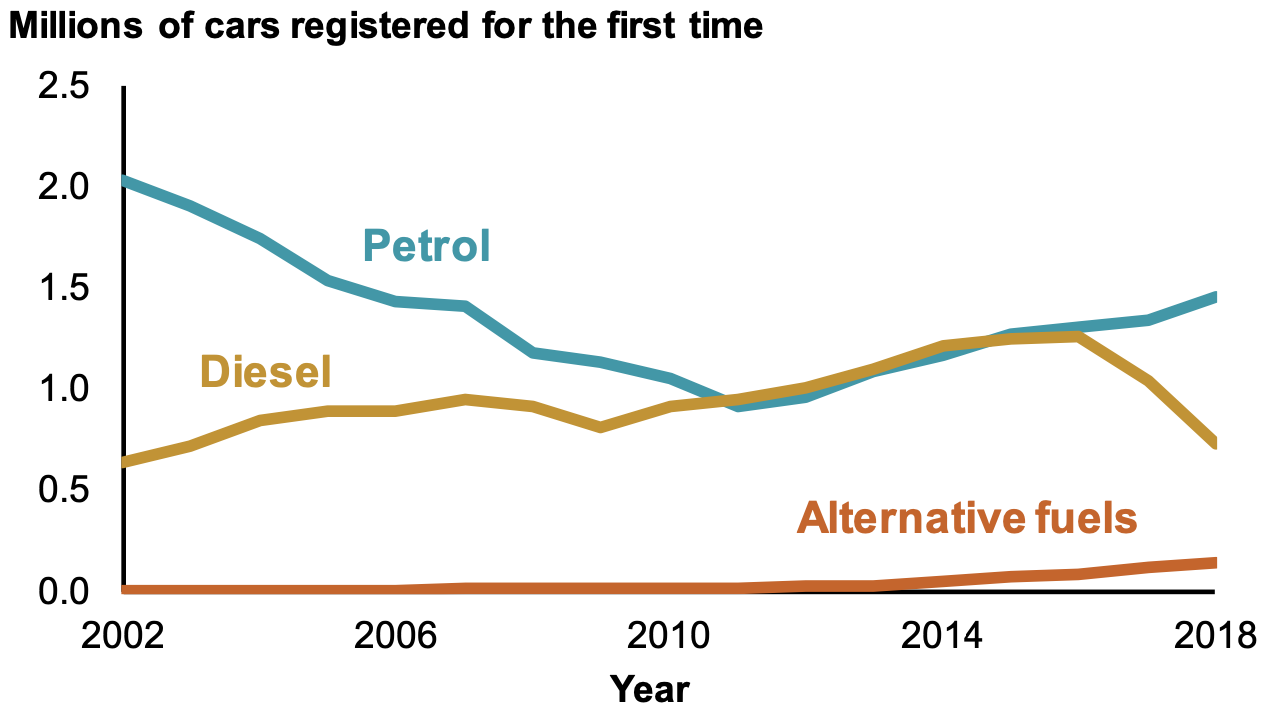
Turning to makes and models, the German manufacturers VW, Audi, BMW and Mercedes-Benz have all become much more commonplace over the last twenty years or more, but Ford still dominates. The top five makes for new registrations were Ford (11%), Volkswagen (8%), Vauxhall (7%), Mercedes-Benz (7%), and BMW (7%).
Counting all cars, old and new, on the road, there are 1.55m Ford Fiestas (4.0% of all cars), plus 1.26m Ford Focus (3.2%) and even 1m Ford Transit vans, four times more than any other type of van. The third and fourth most popular cars, with 1.1m (2.8%) of each, are the Vauxhall Corsa and Volkswagen Golf. Building on its upper-class image during the 1980s and 1990s, and the subsequent rise of SUVs, the 14th most popular car is the Range Rover with over 392,000 examples (1.0% of all cars); the Landrover Discovery follows a little way behind with 256,000 (0.7%).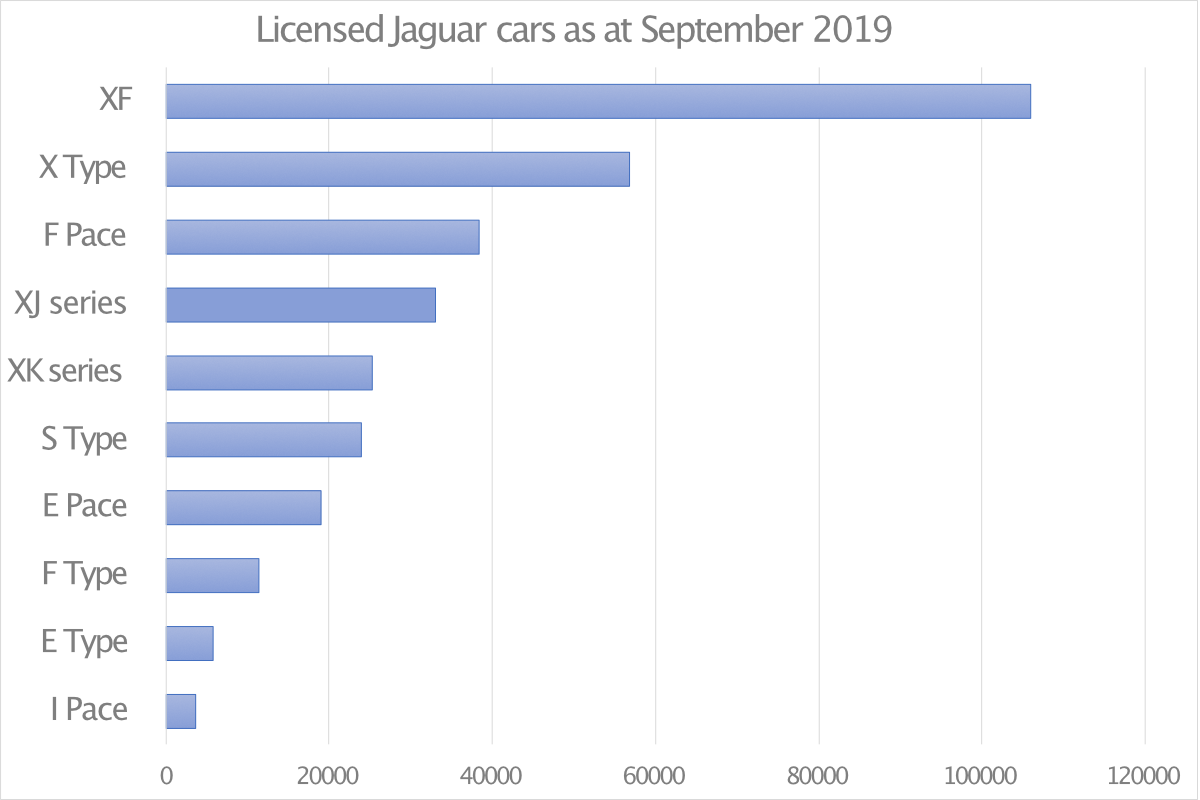
What about Jaguars? Well, they are a bit more exclusive. If you add every type of Jaguar together, old and new, the combined total only comes to 380,000 (1.0%), fewer than the number of Range Rovers. The most popular model is the XF, with 106,000 examples while there are only 3,674 I-Paces, which of course was launched only quite recently.
I noted with interest that E-Types feature quite high on the list with 5,743 examples on the road. And the rarest? The big saloons from the late 1950s and early 1960s, with just 127 Mk VIIs, 52 Mk VIIIs, 153 Mk IXs and 51 Mk Xs. This led me to imagine that perhaps a lot of old Jaguars would be off the road on SORN, but I was surprised. Yes, some 52,150 Jaguars were on SORN (1.1% of all SORNed cars, much the same proportion as those on the road), but 72% of them were under 25 years old. Where have all the classic Jaguars gone?
Finally, the DVLA also tells us where the rate of car ownership is highest and lowest. At first surprising but logical when you think about it, the region with the smallest number of vehicles per person is London, which has 348 vehicles per 1000 head of population, markedly lower than anywhere else. Indeed, the lowest of any local authority in the country is Tower Hamlets, with just 173 per 1000. This compares with a national average of 596 vehicles per 1000 people, and 729 per 1000 in the South West, the highest of any region. The South West also has the highest proportion of ‘other vehicles’ – all those tractors and harvesters, presumably – and vans. But this still pales in comparison with Rushmoor local authority (covering Aldershot and Farnborough) which apparently has 1,693 vehicles per 1000 people. I wonder if the army might have something to do with that?
Richard Gibby